You are currently logged in as an
Institutional Subscriber.
If you would like to logout,
please click on the button below.
Home / Loudness Basics
Loudness is the perceived “strength” of a sound on a scale from quiet to loud. It is a subjective measure that considers the sound intensity, frequency and duration of acoustic or electronically reproduced sounds. These characteristics have been combined in technical standards by the AES and other organizations to permit live and long-term measurement of loudness. To improve the listener experience, loudness measurement techniques and devices have been developed to help content creators and engineers to record, mix, distribute and reproduce audio.
These age-old problems are solved by cooperation in content creation, distribution, and design of playback devices. It’s important for everyone in the audio industry to understand concepts of loudness!
Constantly adjusting playback volume is annoying for the listener and invites turning off the content.
Here we take a brief tour around topics related to loudness, including the concepts behind loudness, how loudness is measured, and how these measurements are used to manage loudness during audio production, distribution, and playback. Further details and side context are also included in the many ”Learn More” sections.
Audio level measurement is as old as the science of electrical audio. Even before radio, telephone system engineers in the early 1900s needed to define signal changes in voice circuits, adopting a “mile of standard cable” as an audio unit of measurement! In 1924 Bell Laboratories established the logarithmic ratio (base 10) between two signal powers called a “bel” after Alexander Graham Bell.

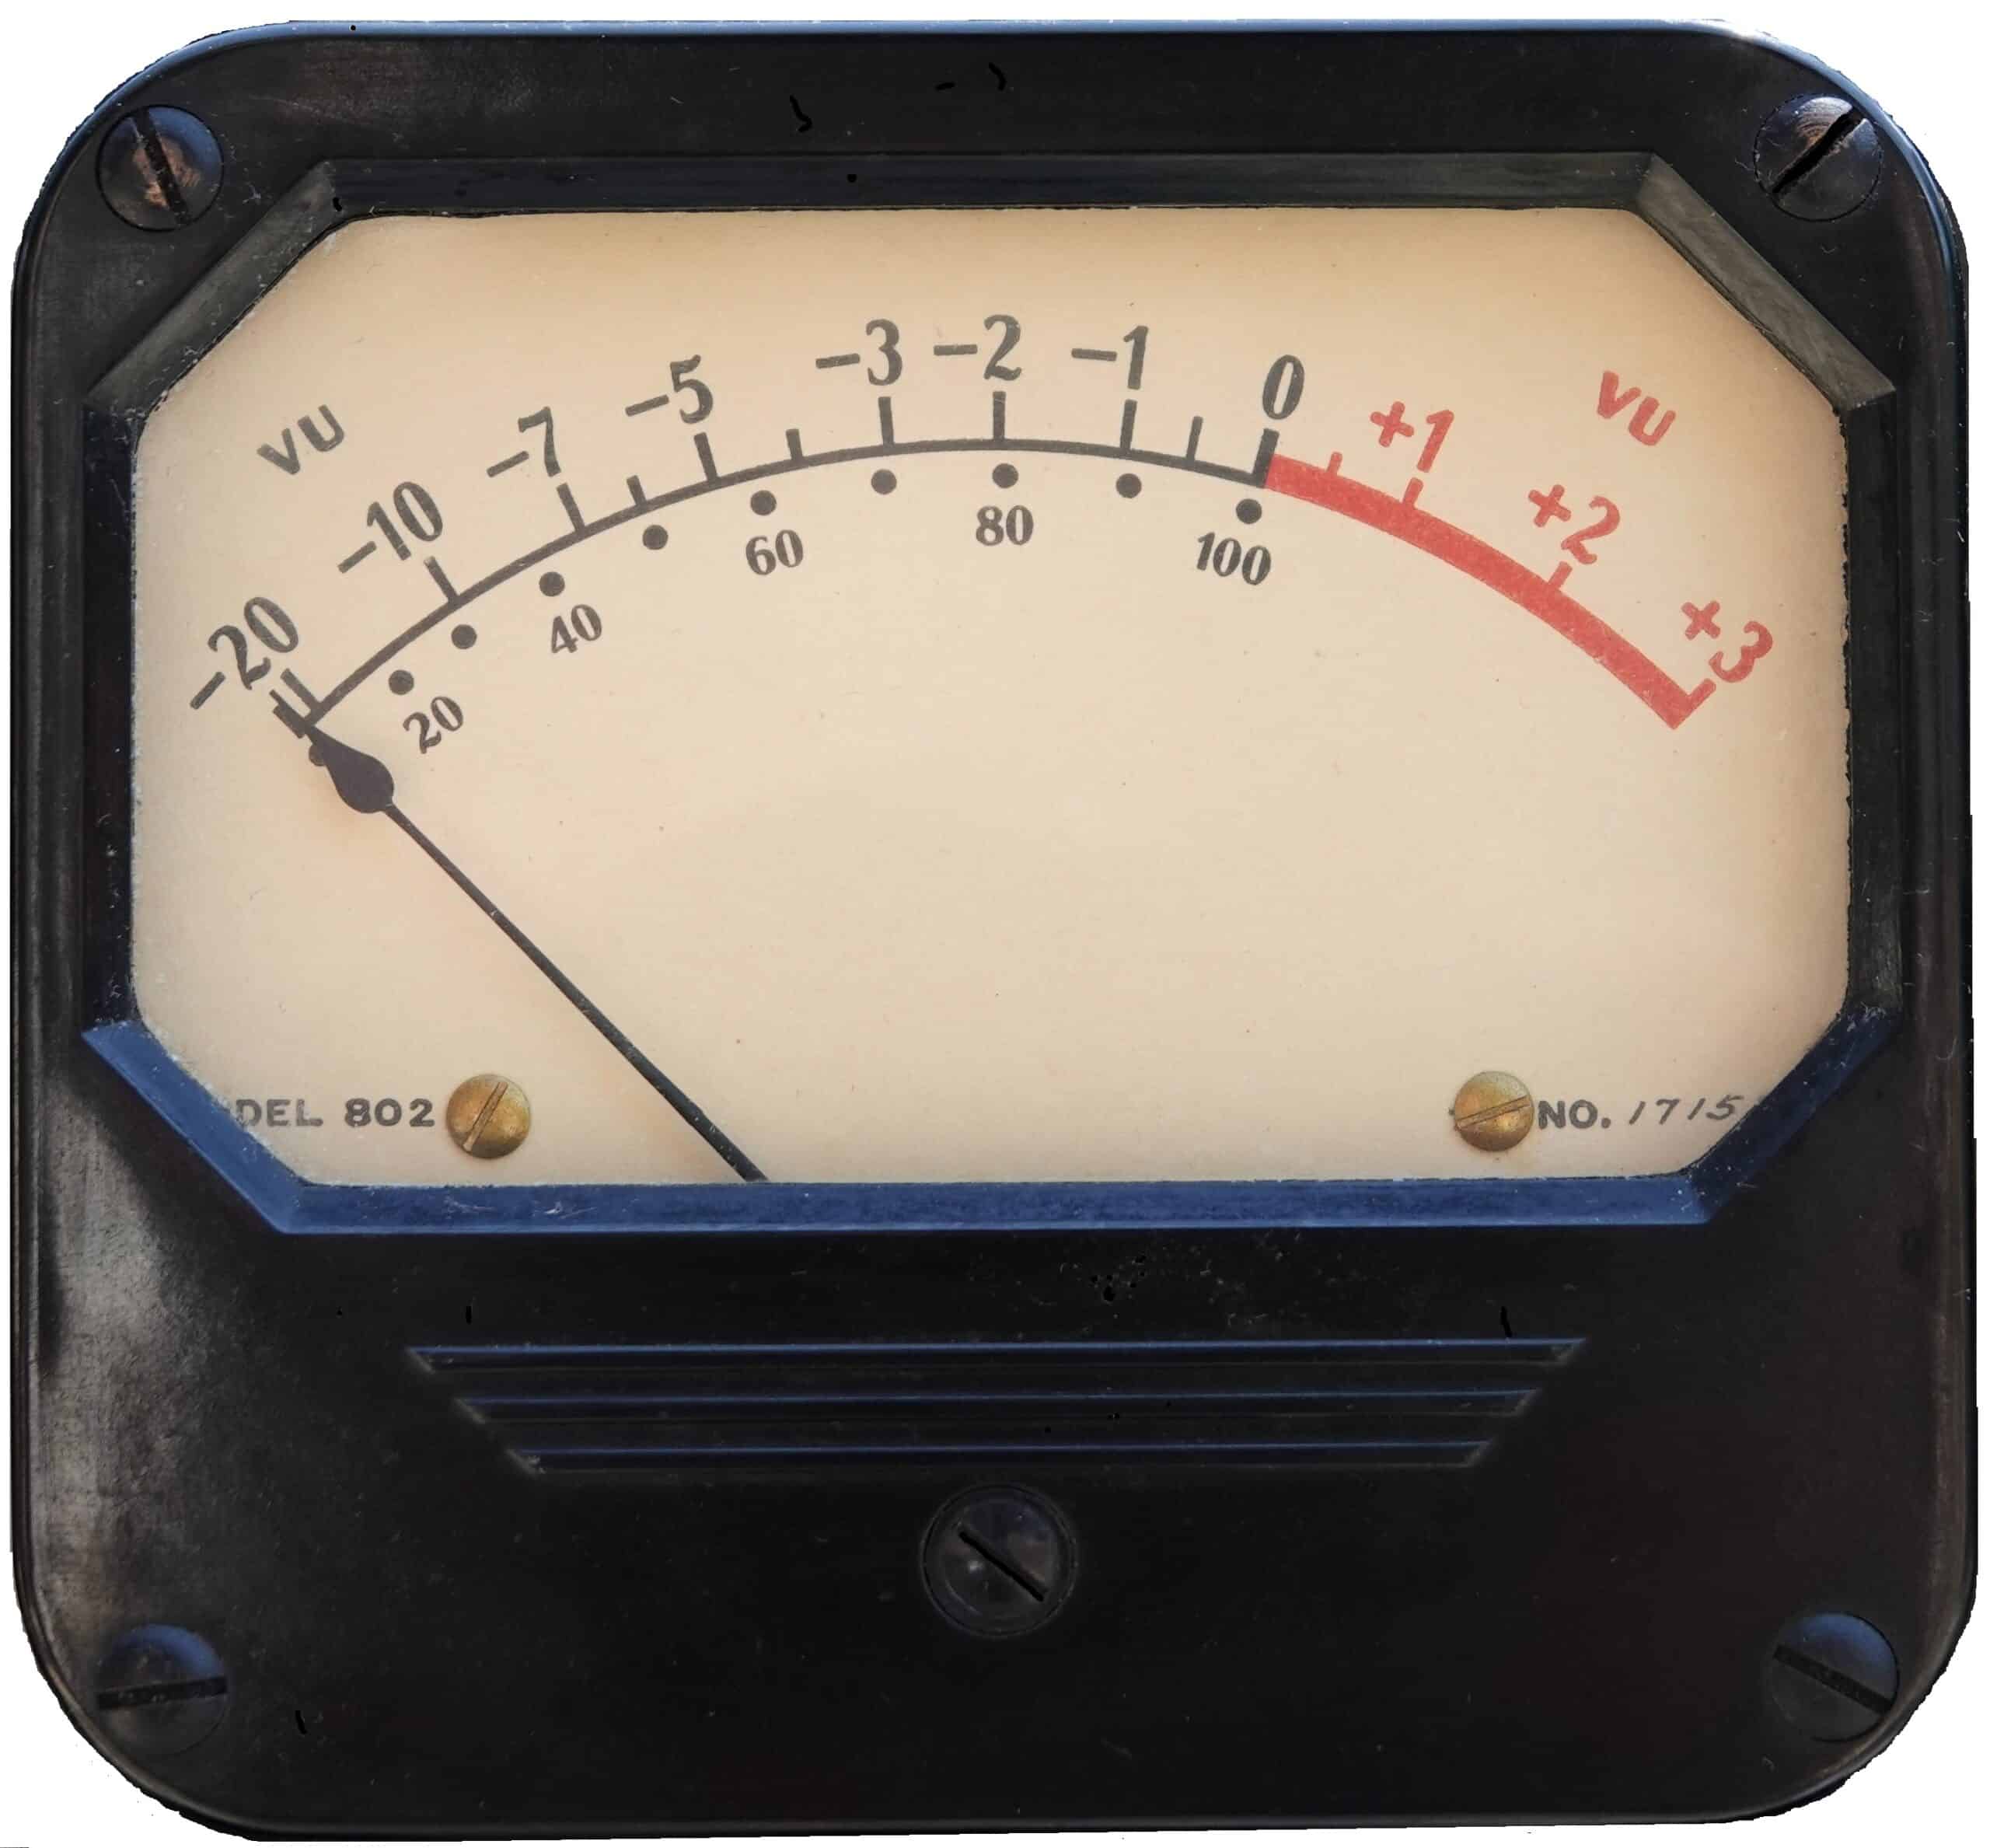
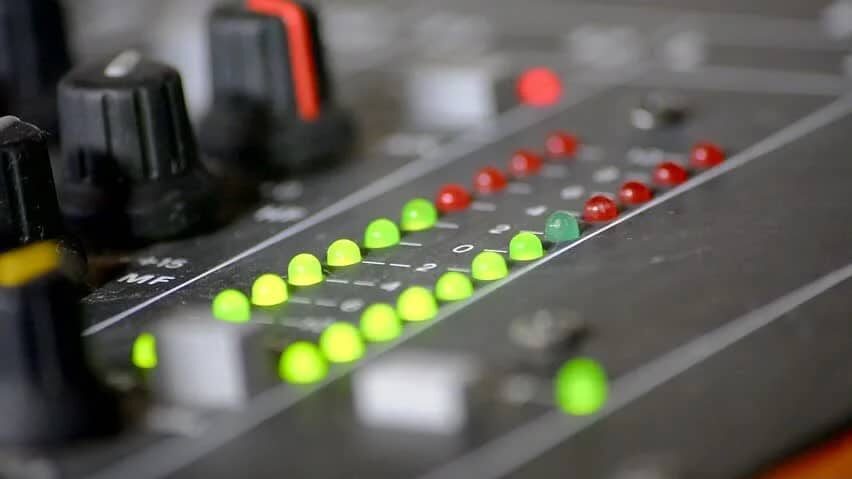
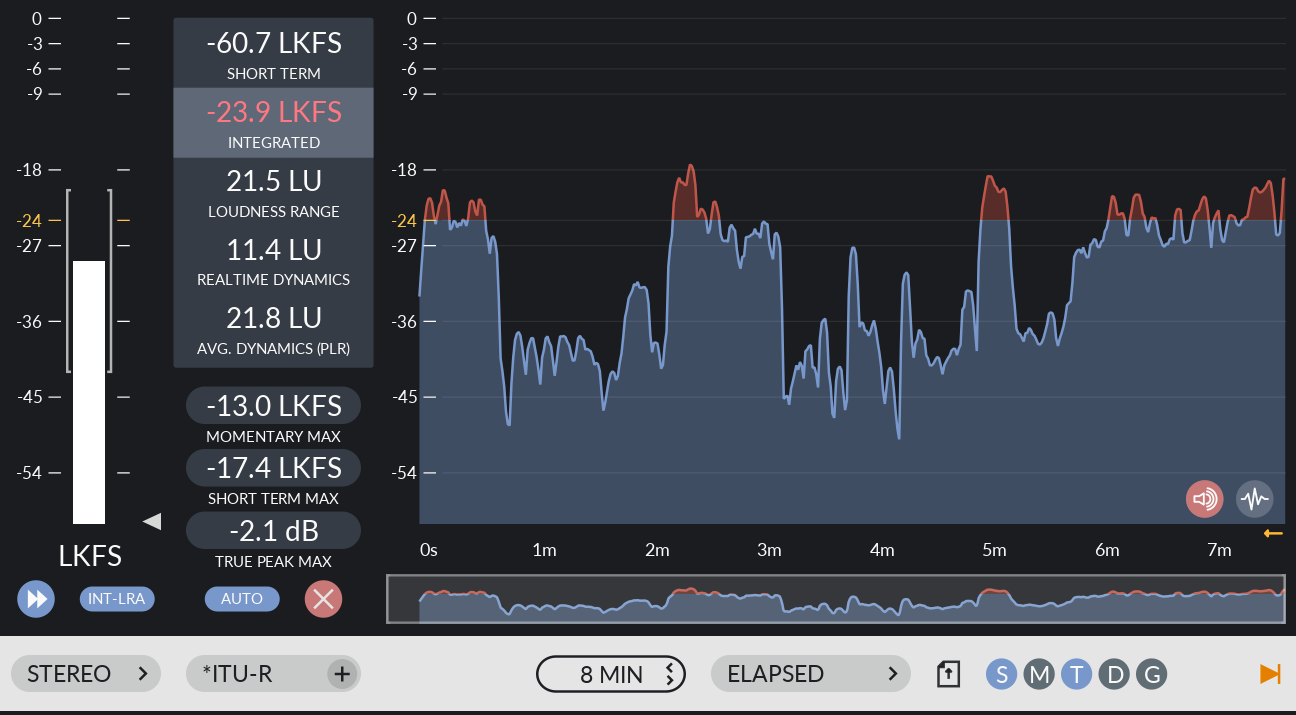
An evolution of audio metering: Type 203C volume indicator, circa 1922 – standard VU meter, 1939 – LED-type VU meter built into equipment – software-based
images can be enlarged by clicking on them
The “decibel” became the reference unit because a one-tenth of a bel in loudness difference between two sounds was identified as the smallest difference detectable by human hearing. That helped, but a variety of mechanical and electrical meter movements and scale types were used, such as the Type 203C volume indicator.
In 1939, Bell Laboratories developed the Volume Indicator, calibrated in Volume Units, and hence known as the VU meter. This famous meter had a standardized time-averaging ballistic that compared our ear’s sense of loudness with program material. As we shall see the VU meter had its shortcomings. Learn More: The venerable VU meter
The perception of audio loudness is primarily determined by two physical elements: the average power and the frequency distribution of the signal. The average power of a signal is proportional to the square of the ‘RMS’ (Root Mean Square) of the amplitude values.
VU meters approximated signal RMS and provided a good indication of program loudness, but their limited scale range (half of their scale displays only 6 dB) made them less suited to advanced recording technology toward the end of the last century. In the 1980s, an improved meter with electronic circuitry was developed to display signal RMS and offered scale ranges of 50 dB or more. Learn More: How is RMS computed and how to interpret it? RMS meters have relatively slow response times to help read fast-changing audio signals. Like VU meters, however, this meter failed to display sudden peaks in audio signals that could overload the stages they were measuring.
In earlier audio technology, analog circuits and tape recorders tended to have “soft” overload characteristics so short peak distortion was less noticeable. When digital audio systems came into use, it was realized that these circuits overload abruptly and more audibly, making slow VU and RMS meters unsuited to warn against peak overload. Some RMS meters added peak indicator lights to warn of even the shortest signal overload.
Avoidance of signal overload led to development in the 1990s of meters displaying only signal peaks. While these meters helped avoid audible signal overload, they are poor indicators of loudness because our hearing is quite insensitive to signal peaks. The following demonstrates the trouble with peak metering.
The figures below show two waveform envelopes of an audio signal: the one on the right (A) is the original sample of 10 seconds of music and the one on the left (B) is the same audio after heavy compression and limiting.


Both of these waveforms have a maximum peak level of -1.0 dBFS and indicate the same, or nearly the same, on peaking-reading meters. However, these samples sound very different, as demonstrated by playing the two files below.
File A has a loudness of -13.4 LUFS while File B has a loudness of -9.1 LUFS, or more than 4 LUFS louder. (These are approximate since accurate loudness values require more time.) File B sounds dynamically compressed and even exhibits some compression artifacts.
The fact that peak meters would indicate the same illustrates why peak measurement is not a good indicator for mixing and distributing audio (other than warning of peak overload). Dependence on peak displays (rather than hearing) led to problems with poorly matched audio content. Peak indicators also promoted use of peak limiters, which can damage the dynamic quality of sound when overused. Learn more: Peak Metering
Loudness meters do use RMS measurement, which provides consistent readings with complex audio signals. ITU meters employ a carefully developed combination of time weighting and level gating to represent the perceptual loudness of varied material including voice, music and sound effects. For more information of these characteristics see Learn More: How the Loudness Meter Works
The approximation of loudness via RMS was refined with one other psychoacoustic principle based on the fact that the ear is not equally sensitive to all frequencies. This frequency-dependent effect can be approximated using a technique known as frequency weighting. The ear’s sensitivity to higher frequencies has been known since the Fletcher-Munson Curves, developed by Bell Telephone Labs in the 1920s. Learn More: Equal loudness contours

Chart Showing Ear’s Sensitivity to Sound is Greatest in 1000 to 5000 Hz Range
Frequency weighting can be visualized as a curve, much like visualizing filters or an equalizer. The frequency weighting method is then: before measuring RMS, filters or EQ (equalization) are applied, which change the relative proportions of the frequencies in the audio. Learn More: K-weighting and other frequency weighting schemes
Despite the complexity of human perception to sound, combining the elements of RMS measurement and frequency weighting make it possible to define loudness measurements accurately and efficiently. To address the need for an objective measure of loudness for broadcasting use, the ITU-R formed a group to work to study this. The work resulted in ITU-R BS.1770, which specifies an algorithm for the objective measure of the loudness of an audio programme. It is based on an algorithm by Dr. Gilbert Soulodre of the Communications Research Centre, Canada, see the AES Papers The Subjective Loudness of Typical Program Material, Objective Measures of Loudness, and Evaluation of Objective Loudness Meters, and Recommendation ITU-R BS.1770-5 for more details.
It defines how to compute Integrated Loudness – a single number that represents the average perceived loudness over the entire audio content, which might be a song, a music album or a whole program. The algorithm is conceptually very simple:
The unit of loudness measurement in ITU-R BS.1770 (BS.1770 for short) is LKFS (Loudness K-weighted relative to Full Scale). LUFS (Loudness Units relative to Full Scale) is also another term for the same unit of measurement. Throughout this page, we will use the term LUFS. Like dBFS (decibels relative to full scale), LUFS are negative numbers, where sounds are perceived as quieter as the numbers move more negative. An LU (Loudness Unit) is a relative value (the difference) between two measurements in LUFS and is equivalent to decibels (dB). If the target loudness is -24 LUFS it may be considered 0 LU and one could say the measurement is “+2 LU” (-22 LUFS) or “-5 LU” (‑29 LUFS).
Learn more: View a video on loudness measurement, presented at the AES New York 2024 Convention by Cornelius Gould.
Changes in loudness are a natural part of sound and perceptual studies find that listeners accept or even prefer loudness changes in audio content. By the same token, studies show that listeners dislike large changes in loudness between unrelated audio content, such as a commercial announcement within a TV or radio program, or when changing channels or sources. This consistency is known as a “comfort zone”.

Listener’s Behavior After a Change in Loudness Occurred
IF the Change Was Frequent
This chart shows how listeners in a study would behave when the loudness changed by different amounts: with changes in apparent loudness up to 3 dB they were tolerant, but beyond that they had to adjust the volume control, with rising numbers wanting to turn off their audio device. Obviously, annoying or losing listeners should be avoided, which is solved by loudness management.
Loudness Management is a method for controlling audio gain during production of content to achieve a desired loudness value when integrated over the full length of the content. Loudness management does not mean that all sounds must be at the same loudness! Dynamics are a natural and enjoyable part of listening, and sounds are expected to vary in loudness within the duration of content, as the content creators intended.
The worldwide TV broadcast industry (and in Europe, much of the radio broadcast industry) was one of the first major success stories for loudness-based normalization. Broadcast systems normalize all content, including advertisements, to -24 or -23 LUFS. A growing number of industries for audiovisual content or audio-only content are beginning to adopt loudness normalization (see below), but with different loudness targets. This is a great step forward, but it is still a problem that different ecosystems have different target loudness values and different nuances, and this is why the AES Broadcast and Online Delivery Technical Committee has been putting forth recommendations and standards. TD1005 and TD 1006 are recommendations while AES 71 is an established standard that focuses on loudness normalization practices for audiovisual online distribution. The Consumer Electronics Association aligned with that standard to create ANSI/CTA-2075 to cover playback on devices. TD1008 is an evolving AES recommendation focusing on audio-only online distribution.
Normalization, is the active level matching of audio content to a defined or “target” loudness. Normalizing avoids listener annoyance and their need to reach for the volume control when the content changes. To normalize audio, the amplitude of the audio signal is scaled uniformly over the length of the content, such as a full record album or radio program. For example, if the content originally measured -27 LUFS, +3 LU of gain would result in a new loudness of -24 LUFS. See the Loudness Normalization section on the Home Page for a full description.

Two Primary Types of Audio Content Normalization
One approach to loudness management, now out of date, is peak normalization. As shown on the left, above, audio gain was set for signal peaks to reach a permitted maximum level, for example -2 dBFS (2 dB below system full scale). This leads to uniform peak levels in program segments, but it results in varying (and potentially unnatural) loudness levels (the wavy green line between program segments) because perceived loudness is not well-related to signal peaks.
As shown on the right, normalization to a desired or “target” loudness measures the loudness (or average dialog loudness) of programs or program segments and adjusts the gain of each of them to target value. Signal peaks are monitored and gain may be adjusted downward if maximum peak level is approached. Learn More: album and track normalization techniques in the Loudness Normalization section
Major success has been achieved in loudness management worldwide for broadcast and media, including online streaming of audio/video content, and is now gaining use in distribution of audio content for streaming, podcasts and on-demand music services. Loudness-based “normalization” is the process that achieves that success.