You are currently logged in as an
Institutional Subscriber.
If you would like to logout,
please click on the button below.
Home / Publications / E-library page
Only AES members and Institutional Journal Subscribers can download
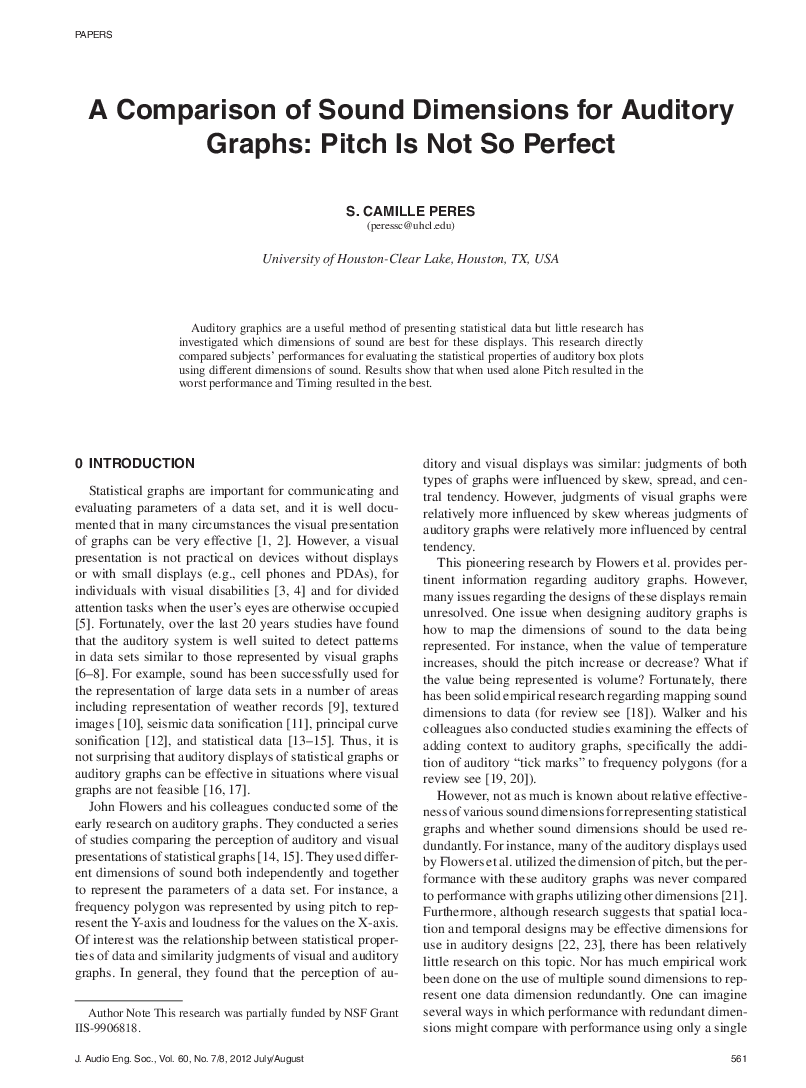
Visually-impaired individuals and sighted individuals who are conducting tasks in divided-attention situations, both benefit from using sound to display information typically communicated visually. Auditory displays of statistical graphs are one such tool and can be effective in these situations. However, it is not obvious how these graphs should be designed. In a series of experiments in which information was conveyed by sound, subjects were divided into two groups: those hearing graphs using integral (pitch and loudness) and separable (pitch and timing) dimensions of sound. The results showed that pitch alone produced the worst performance and timing the best. However, designs using pitch and loudness redundantly provided good results as well.
Author (s): Peres, S. Camille
Affiliation:
University of Houston-Clear Lake, Houston, TX, USA
(See document for exact affiliation information.)
Publication Date:
2012-07-06
Import into BibTeX
Permalink: https://aes2.org/publications/elibrary-page/?id=16367
(127KB)
Click to purchase paper as a non-member or login as an AES member. If your company or school subscribes to the E-Library then switch to the institutional version. If you are not an AES member Join the AES. If you need to check your member status, login to the Member Portal.
Peres, S. Camille; 2012; A Comparison of Sound Dimensions for Auditory Graphs: Pitch Is Not So Perfect [PDF]; University of Houston-Clear Lake, Houston, TX, USA; Paper ; Available from: https://aes2.org/publications/elibrary-page/?id=16367
Peres, S. Camille; A Comparison of Sound Dimensions for Auditory Graphs: Pitch Is Not So Perfect [PDF]; University of Houston-Clear Lake, Houston, TX, USA; Paper ; 2012 Available: https://aes2.org/publications/elibrary-page/?id=16367